Data sampling in Google Analytics 4 (GA4) can sometimes cause confusion.
When reviewing your reports in GA4, the presence of a green icon in the top right corner indicates that your report is unsampled.
Conversely, if you see a yellow percentage sign, it shows the extent to which your report data is sampled.
Let’s explore this feature in more detail.
Data Sampling in GA4 Reports
Data sampling in Google Analytics 4 (GA4) helps manage and analyze large data sets by examining a representative subset. Here’s how it works:
- Standard Reports: These use the full data set and are always unsampled, relying on 100% of the data for the selected time frame.
- Advanced Reports: These can be sampled, especially when dealing with complex or large datasets.
Triggering Data Sampling
GA4 starts sampling data when the number of events in an analysis exceeds what the property can handle. This ensures that data analysis remains manageable by using a representative slice of the data.
Identifying Sampled Data in Report
A yellow icon with a percentage sign indicates that the data is sampled. Hovering over this icon reveals the portion of the total data used in the report.
Importance and Limitations
Data sampling is essential in GA4 for handling large data volumes efficiently. It provides meaningful insights without overwhelming the system, though it is important to note that sampling results in approximations rather than complete data.
How Data Sampling Works in This Report
Data sampling in Google Analytics 4 (GA4) involves analyzing a portion of the total data rather than the entire dataset.
Here’s how the process works:
Determining When to Sample
- Action: GA4 decides to use data sampling.
- Result: Sampling occurs when the data volume surpasses the system’s processing limits, especially in advanced reports with complex or large data sets.
Selecting a Representative Subset
- Action: GA4 selects a subset of the total data.
- Result: This subset is chosen to reflect the characteristics of the full dataset accurately.
Analyzing Sampled Data
- Action: GA4 analyzes the selected data subset.
- Result: Insights from this sample are used to conclude the entire dataset.
Indicating Sampling in Reports
- Action: GA4 shows a clear indication of data sampling on the report.
- Result: A yellow percentage icon appears, with a hover-over message indicating the percentage of data used, making it clear that the report is based on sampled data.
Impact on Reporting Accuracy
- Action: Sampling is used for efficient data analysis.
- Result: While it provides quick insights, sampling introduces approximations, meaning the conclusions are estimates rather than precise reflections of the full dataset. These estimates are generally reliable but come with some uncertainty.
Balancing Efficiency and Accuracy
- Action: GA4 implements data sampling.
- Result: This approach balances the need for quick data analysis with comprehensive and accurate reporting, essential for managing large volumes of web analytics data.
How Data Sampling in GA4 Differs from UA
Sampling Based on Report Types:
- UA: Standard reports are usually unsampled, but ad-hoc queries trigger sampling.
- Standard Analytics: 500,000 sessions
- Analytics 360: 100 million sessions
- GA4: Standard reports are always unsampled, even with custom parameters. Advanced reports may be sampled if data exceeds 10 million events.
Hit Limits:
- UA:
- Monthly hit limit: 10 million per property.
- Daily limit: 200K per user, 500 per session. Exceeding these stops data collection.
- GA4: No hit limits, making it more suitable for high-traffic sites. However, some reports might still be sampled under certain conditions.
Sampling Thresholds:
- UA: Sampling occurs due to excess data.
- GA4: Sampling happens with limited data, indicated by an orange sign. As traffic increases, sampling issues diminish.
Cardinality:
- GA4: Dimensions with more than 25,000-30,000 unique values may lead to rolled-up entries in both standard and advanced reports, affecting data granularity.
GA4 offers more flexibility with no hit limits and always unsampled standard reports, but still imposes some constraints on advanced reports and high-cardinality dimensions.
Differences between Data Sampling and Data Thresholding
Why They’re Used
Data sampling is a method used to quickly analyze large datasets by examining a representative subset. It speeds up report generation by avoiding the need to process all the data. In contrast, data thresholding acts as a privacy filter, ensuring that user data remains protected and compliant with privacy regulations.
When They Occur
Data sampling is applied when dealing with vast amounts of data or generating complex reports. Data thresholding is triggered in scenarios involving sensitive data or when the number of users is too low to maintain anonymity.
Impact on Data
Data sampling means analyzing only a portion of the data, which can affect the precision of the reports. Data thresholding involves hiding or generalizing user data, resulting in less detailed reports to protect user privacy.
Control Over the Process
Users might have some control over the extent of data sampling in their reports. However, data thresholding in GA4 is automatic and not subject to user adjustments.
Recognizing When They’re Applied
Data sampling might not be immediately evident in GA4 reports, whereas data thresholding is typically indicated by visual cues like a red triangle in reports.
Types of Reports in GA4
Standard or Default Reports: Data sampling in GA4 does not occur in the standard reports found under the Reports tab on the left. These reports include:
- Acquisition report
- Real-time report
- Engagement report
- Life cycle report
- Monetization report
- Retention report
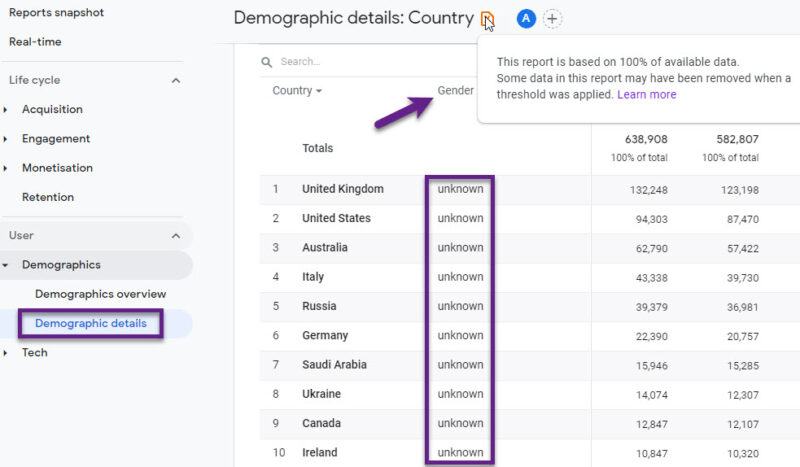
However, the Demographic report might have sampled data to protect user privacy.
With limited data, GA4 allows you to identify visitors through their IDs, devices, or user-generated content fields, which is akin to cookieless tracking—a privacy-focused method of tracking visitor behavior.
Exploration Reports: Exploration reports, also found in the menu on the left, are generally unsampled. GA4 currently offers seven types of exploration reports:
- Blank
- Path exploration
- Free-form
- Funnel exploration
- Cohort exploration
- Segment overlap
- User lifetime
However, data sampling may occur in exploration reports if you add additional dimensions.