Businesses use Data interpretation tools to understand customers and boost online sales. These tools analyze data to reveal customer behavior patterns, allowing companies to make informed decisions that increase conversion rates.
The Role of Data Interpretation in Business
Data interpretation is key for businesses aiming to boost conversion rates. By analyzing data, companies can identify customer behavior patterns that inform strategic decisions. This process helps businesses understand what drives customer actions, allowing them to optimize marketing and improve the customer experience. Data interpretation tools also uncover potential issues in the customer journey, enabling prompt resolution and performance enhancement.
Popular Data Interpretation Tools
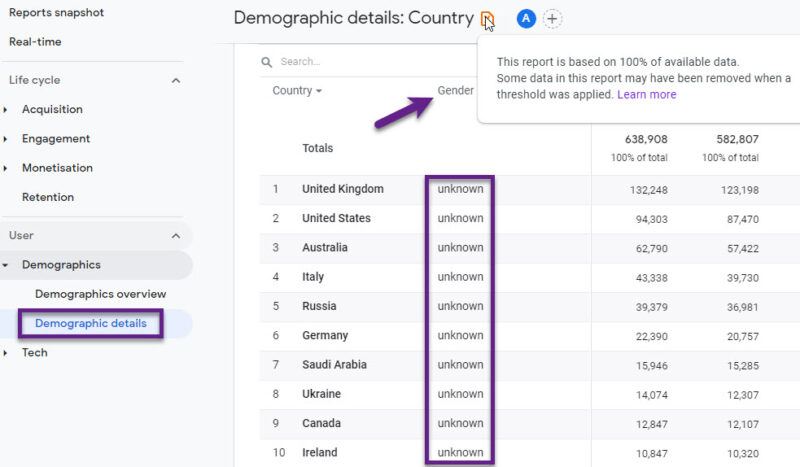
Businesses leverage a variety of data interpretation tools, each with distinct features. Tableau and Power BI excel at data visualization, enabling interactive dashboards. Python and R are powerful programming languages used for advanced statistical analysis and machine learning. Excel remains a versatile staple, while Google Analytics offers detailed insights into website performance and user behavior. These tools empower businesses to make data-driven decisions that drive conversion rate optimization.
| Tool | Features | Best For | Pricing |
|---|---|---|---|
| Tableau | Data visualization, interactive dashboards, real-time data analysis | Businesses needing robust visualization tools | Starts at $70/user/month |
| Power BI | Data analytics, visualization, integration with Microsoft products | Businesses using Microsoft ecosystem | Starts at $9.99/user/month |
| Python | Statistical analysis, machine learning, data manipulation | Data scientists and developers | Free (open-source) |
| Excel | Spreadsheet functionality, data analysis, pivot tables | General business use | Part of Microsoft Office (varied pricing) |
| KNIME | Data analytics, reporting, integration with various tools | Advanced data analytics | Free (open-source) |
| Looker | Data exploration, BI reporting, integration with SQL databases | Businesses needing advanced BI tools | Custom pricing |
| QlikView | Data discovery, visualization, reporting | Interactive data analysis | Custom pricing |
| RapidMiner | Data mining, machine learning, predictive analytics | Advanced data science applications | Starts at $2500/year |
| SAS | Advanced analytics, business intelligence, data management | Large enterprises | Custom pricing |
| Apache Spark | Big data processing, machine learning, real-time analytics | Big data applications | Free (open-source) |
| Jupyter Notebook | Interactive computing, data visualization, integration with various languages | Data scientists and researchers | Free (open-source) |
| Talend | Data integration, big data, cloud integration | ETL processes and big data | Starts at $1170/user/year |
| Google Analytics | Web analytics, user behavior tracking, real-time data | Website performance analysis | Free (premium version available) |
| R | Statistical computing, graphics, data analysis | Statisticians and data miners | Free (open-source) |
| SAS Business Intelligence | Business reporting, data visualization, analytics | Large enterprises | Custom pricing |
| Zoho Analytics | Data visualization, analytics, business intelligence | Small to medium-sized businesses | Starts at $22.50/month |
| Google Sheets | Spreadsheet functionality, real-time collaboration, integration with Google Workspace | General business use | Free (with Google account) |
| SQL | Database querying, data manipulation, relational database management | Database management and analysis | Free (varies by implementation) |
| Airtable | Spreadsheet-database hybrid, real-time collaboration, customizable views | Project management and organization | Starts at $10/user/month |
| Apache Hadoop | Big data storage and processing, scalable, distributed computing | Big data applications | Free (open-source) |
Enhancing User Experience to Drive Conversions
Data interpretation tools enable businesses to optimize user experience and boost conversion rates. By analyzing customer behavior data, companies can identify pain points, like high cart abandonment rates at checkout. Addressing these issues creates a more seamless, intuitive experience that encourages customers to complete purchases. Enhancing UX not only makes the website more appealing but also directly drives higher conversion rates as the buying journey becomes frictionless. This data-driven approach to continuous UX improvement is crucial for driving sustainable conversion rate growth.
Personalizing Marketing Strategies for Higher Conversions
Data analysis empowers businesses to personalize marketing, boosting conversion rates. By segmenting audiences based on data insights, companies can deliver targeted campaigns that resonate powerfully. Personalized emails, product recommendations, and tailored content create experiences that make customers feel valued, fostering trust and loyalty. This data-driven personalization strategy is crucial for driving higher conversions through more effective, engaging marketing.
Optimizing Product Offerings for Improved Conversions
Data interpretation empowers businesses to optimize their product offerings, driving higher conversion rates. By analyzing sales data, companies can identify top-performing products as well as underperformers. This insight informs strategic decisions around inventory management, product development, and pricing. If a particular product consistently underperforms, the business can choose to discontinue it or revamp it to better align with customer needs. Conversely, high-selling products can be prioritized for further promotion, maximizing their revenue potential.
This data-driven approach to product optimization ensures the business is meeting customer demand more effectively. Ultimately, optimizing the product catalog based on data insights is a powerful lever for boosting conversions. By curating an offering that resonates with the target audience, businesses can capture more sales and cement stronger, more profitable customer relationships.
Improving Customer Support
Customer support is another area where data interpretation tools can have a significant impact. By analyzing customer support data, businesses can identify common issues and pain points that customers experience. This information can be used to improve support processes and provide better solutions to customers. For example, if data shows that a large number of customers are experiencing difficulties with a particular feature, the business can provide additional resources or training to help them. Improving customer support not only enhances customer satisfaction but also builds trust and loyalty, which are crucial for increasing conversion rates.
Real-Time Decision Making for Agile Conversion Rate Optimization
One of the greatest advantages of data interpretation tools is the ability to enable real-time decision making. These solutions provide businesses with real-time data analysis and reporting, empowering them to respond swiftly to evolving market conditions and customer behaviors. For instance, if a marketing campaign is underperforming, the business can quickly analyze the data and make strategic adjustments to improve its effectiveness. This agile, data-driven approach is essential for maintaining a competitive edge and driving sustainable conversion rate growth. Real-time decision making allows companies to stay nimble and responsive, capitalizing on opportunities and addressing challenges as they arise. It’s a critical capability in today’s fast-paced, dynamic business landscape.
Conclusion
Data interpretation tools are invaluable assets for businesses seeking to boost their conversion rates. By unlocking deep customer insights, these solutions enable enhanced user experiences, personalized marketing strategies, optimized product offerings, and agile decision making. Leveraging data-driven intelligence is now a strategic imperative for growth-minded companies navigating the digital world. As businesses continue to harness the power of data interpretation, they’ll be well-positioned to drive sustainable increases in conversions and cement their long-term success.
Related Posts:
- 7 Common Pitfalls in Data Interpretation and How to…
- LinkedIn Tools Explained: Unlocking the Potential of…
- How Can Data Analysis Improve Your Marketing Strategy?
- Is Machine Learning the Future of Data Analysis?
- Everything You Need To Know About Data Sampling in GA4
- How to Set Up Conversion Tracking in GA4: Key Events


