Google Analytics is a tool that helps people understand how people use their websites. Custom Google Analytics Reports show things like how often people visit pages, how long they stay, and who they are.
These reports can be helpful, but sometimes you need more specific information. That’s where custom reports come in. This article will show you how to make your own custom reports in Google Analytics.
A ton of pre-made reports
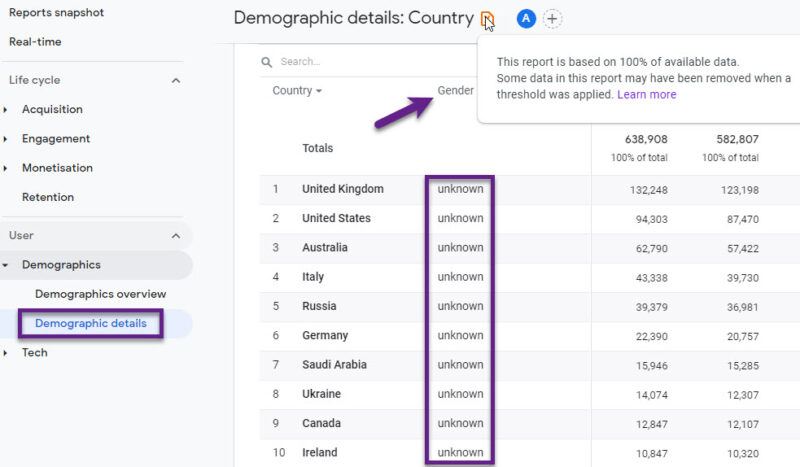
Google Analytics has a ton of pre-made reports about your website. These cover things like how many people leave right away, how many pages they look at, and info about who’s visiting. The reports are helpful, but sometimes you need to see certain metrics side-by-side to understand them better.
Custom reports let you pick exactly the data you want in one view. This makes your analysis faster and helps you make decisions quicker. By tailoring the reports to your specific needs, you can get more precise and useful insights. This lets you improve your website’s performance in a more targeted way.
Overall, custom reports are super handy. They give you the flexibility to structure the data how you need it. This is a game-changer for understanding your website and making smart choices.
Accessing the Custom Reports Section
To begin creating a custom report, navigate to the Google Analytics platform. On the left-hand side menu, click on “Customization” and then select “Custom Reports.” This will take you to the custom reports library, where you can see existing custom reports and have the option to create new ones.
Accessing the custom reports section is straightforward. By navigating to the customization tab, you can begin building a report that fits your unique requirements. This section houses all your custom reports, making it easy to manage and modify them as needed.
Using the Custom Report Library
In the custom reports library, you have several options: build a new custom report from scratch or import preset reports. Preset reports can be customized further to suit your requirements, including reports for paid search, social traffic, and more.
The custom report library is a powerful tool within Google Analytics. It provides a starting point with preset reports that can be modified or the flexibility to build entirely new reports from scratch. This flexibility ensures you can get the exact data insights you need.
Creating a New Custom Google Analytics Reports
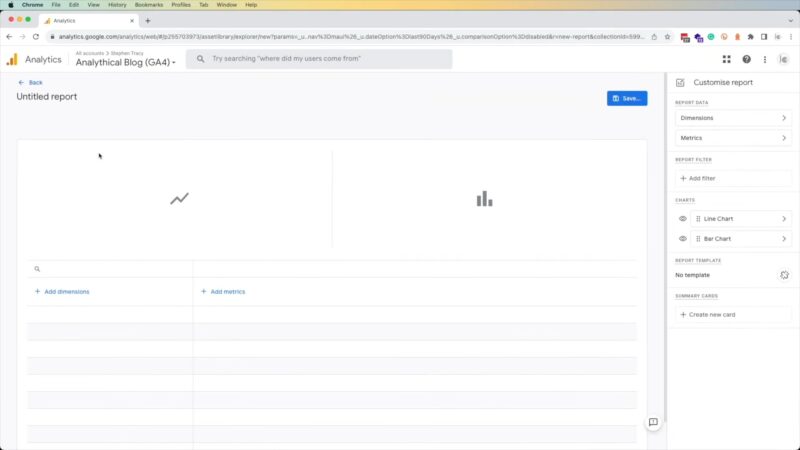
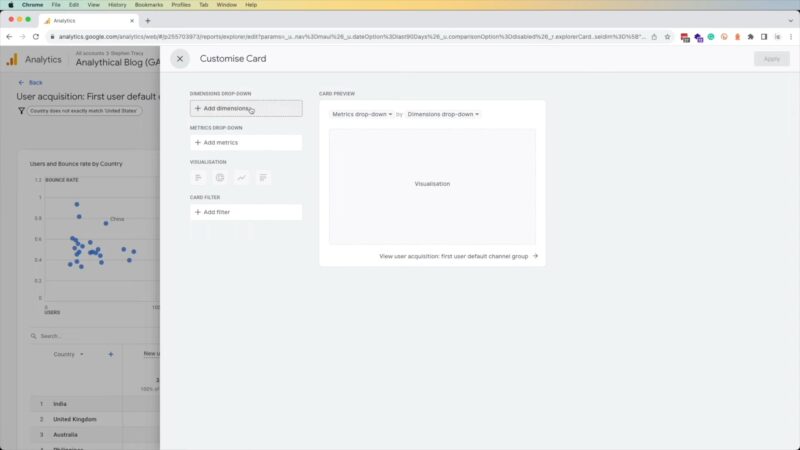
To create a new report from scratch, click on “New Custom Report.” You will be directed to an editor where you can configure your report. Here are the main components you need to set up: title and report tab, metric groups, dimension drill downs, filters, and views.
Creating a new custom report involves several steps. First, you need to set the title and report tab. Then, add the metrics and dimensions you want to analyze. Applying filters and selecting the appropriate views ensures that your report provides the most relevant data.
Title and Report Tab
Give your report a meaningful title and name your report tab, such as “Explorer” for an exploratory report type. The title and report tab is crucial for organization. A meaningful title helps you quickly identify the report’s purpose, while the report tab categorizes the type of data analysis you are performing.
Metric Groups
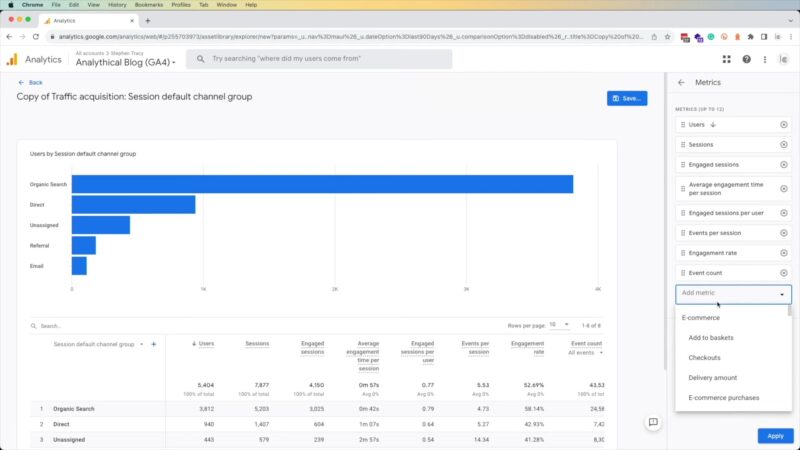
Add the metrics you want to analyze. Commonly used metrics include sessions, bounce rate, and average session duration. You can also search for specific metrics if they are not listed in the commonly used section.
Metric groups are the backbone of your custom report. They define the specific data points you will analyze. Choosing the right metrics ensures that your report focuses on the most critical aspects of your website’s performance.
Dimension Drilldowns
In Google Analytics, you can break down your data by choosing different “dimensions.” For example, you might look at how your campaigns perform on different devices. This lets you get really detailed insights.
By picking the right dimensions, you can slice your data in helpful ways. This can reveal trends and patterns you might have missed otherwise. Dimension drill-downs give you a super close look at your metrics.
Filters
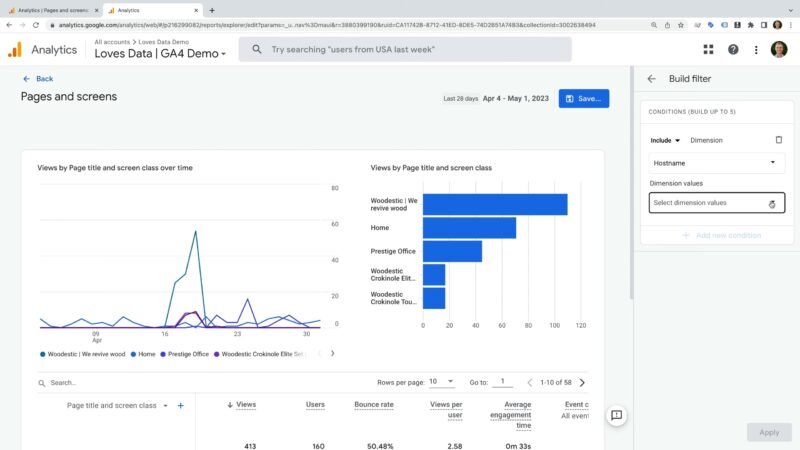
Apply filters to narrow down your data. For instance, you can filter for only Google paid search traffic by setting the source/medium filter to “google/cpc.” Filters are essential for focusing your analysis. They allow you to exclude irrelevant data and hone in on the specific segments that matter most to your business objectives.
Views
Select the Google Analytics views where you want this custom report to be available. You can add the report to all views associated with your account or specific ones. Assigning views to your custom report determines its accessibility. By selecting the appropriate views, you ensure that the right team members have access to the data they need.
Example: Analyzing Campaign Performance
Let’s create a custom report to analyze how different campaigns perform across various devices over the course of a year. Add metrics like sessions, bounce rate, and average session duration. Select “Campaign” and “Device” as your primary and secondary dimensions.
Filter the data to include only Google CPC traffic. Decide whether to add this report to all views or specific ones. Analyzing campaign performance using a custom report allows you to measure the effectiveness of your marketing efforts. By comparing metrics across different campaigns and devices, you can identify successful strategies and areas for improvement.
Benefits of Custom Reports
Custom reports in Google Analytics offer several advantages: tailored data, efficiency, and flexibility. Tailored data means you view the specific metrics that matter most to your business side by side. Efficiency allows you to make quicker decisions with all relevant data in one place.
Flexibility lets you customize reports to suit different needs, whether for detailed analysis or high-level overviews. Custom reports provide significant benefits by offering tailored insights. This efficiency in data analysis translates into faster, more informed decision-making, enabling businesses to respond swiftly to changing conditions.
Conclusion
Custom Google Analytics Reports are really useful. They let you see the exact data you want, all in one place. This makes it easier to make decisions and improve your website. By making your own custom reports, you can get the information you need to help your business do better online. Start making custom reports today and you’ll be able to get more out of Google Analytics!